Game
Analytics Dashboard
for Firebase & BigQuery
Turn your Firebase Analytics and BigQuery export into actionable game KPIs — including retention, ARPDAU, LTV, revenue analytics, and cohort insights — without writing SQL.
Built for indie mobile game studios.
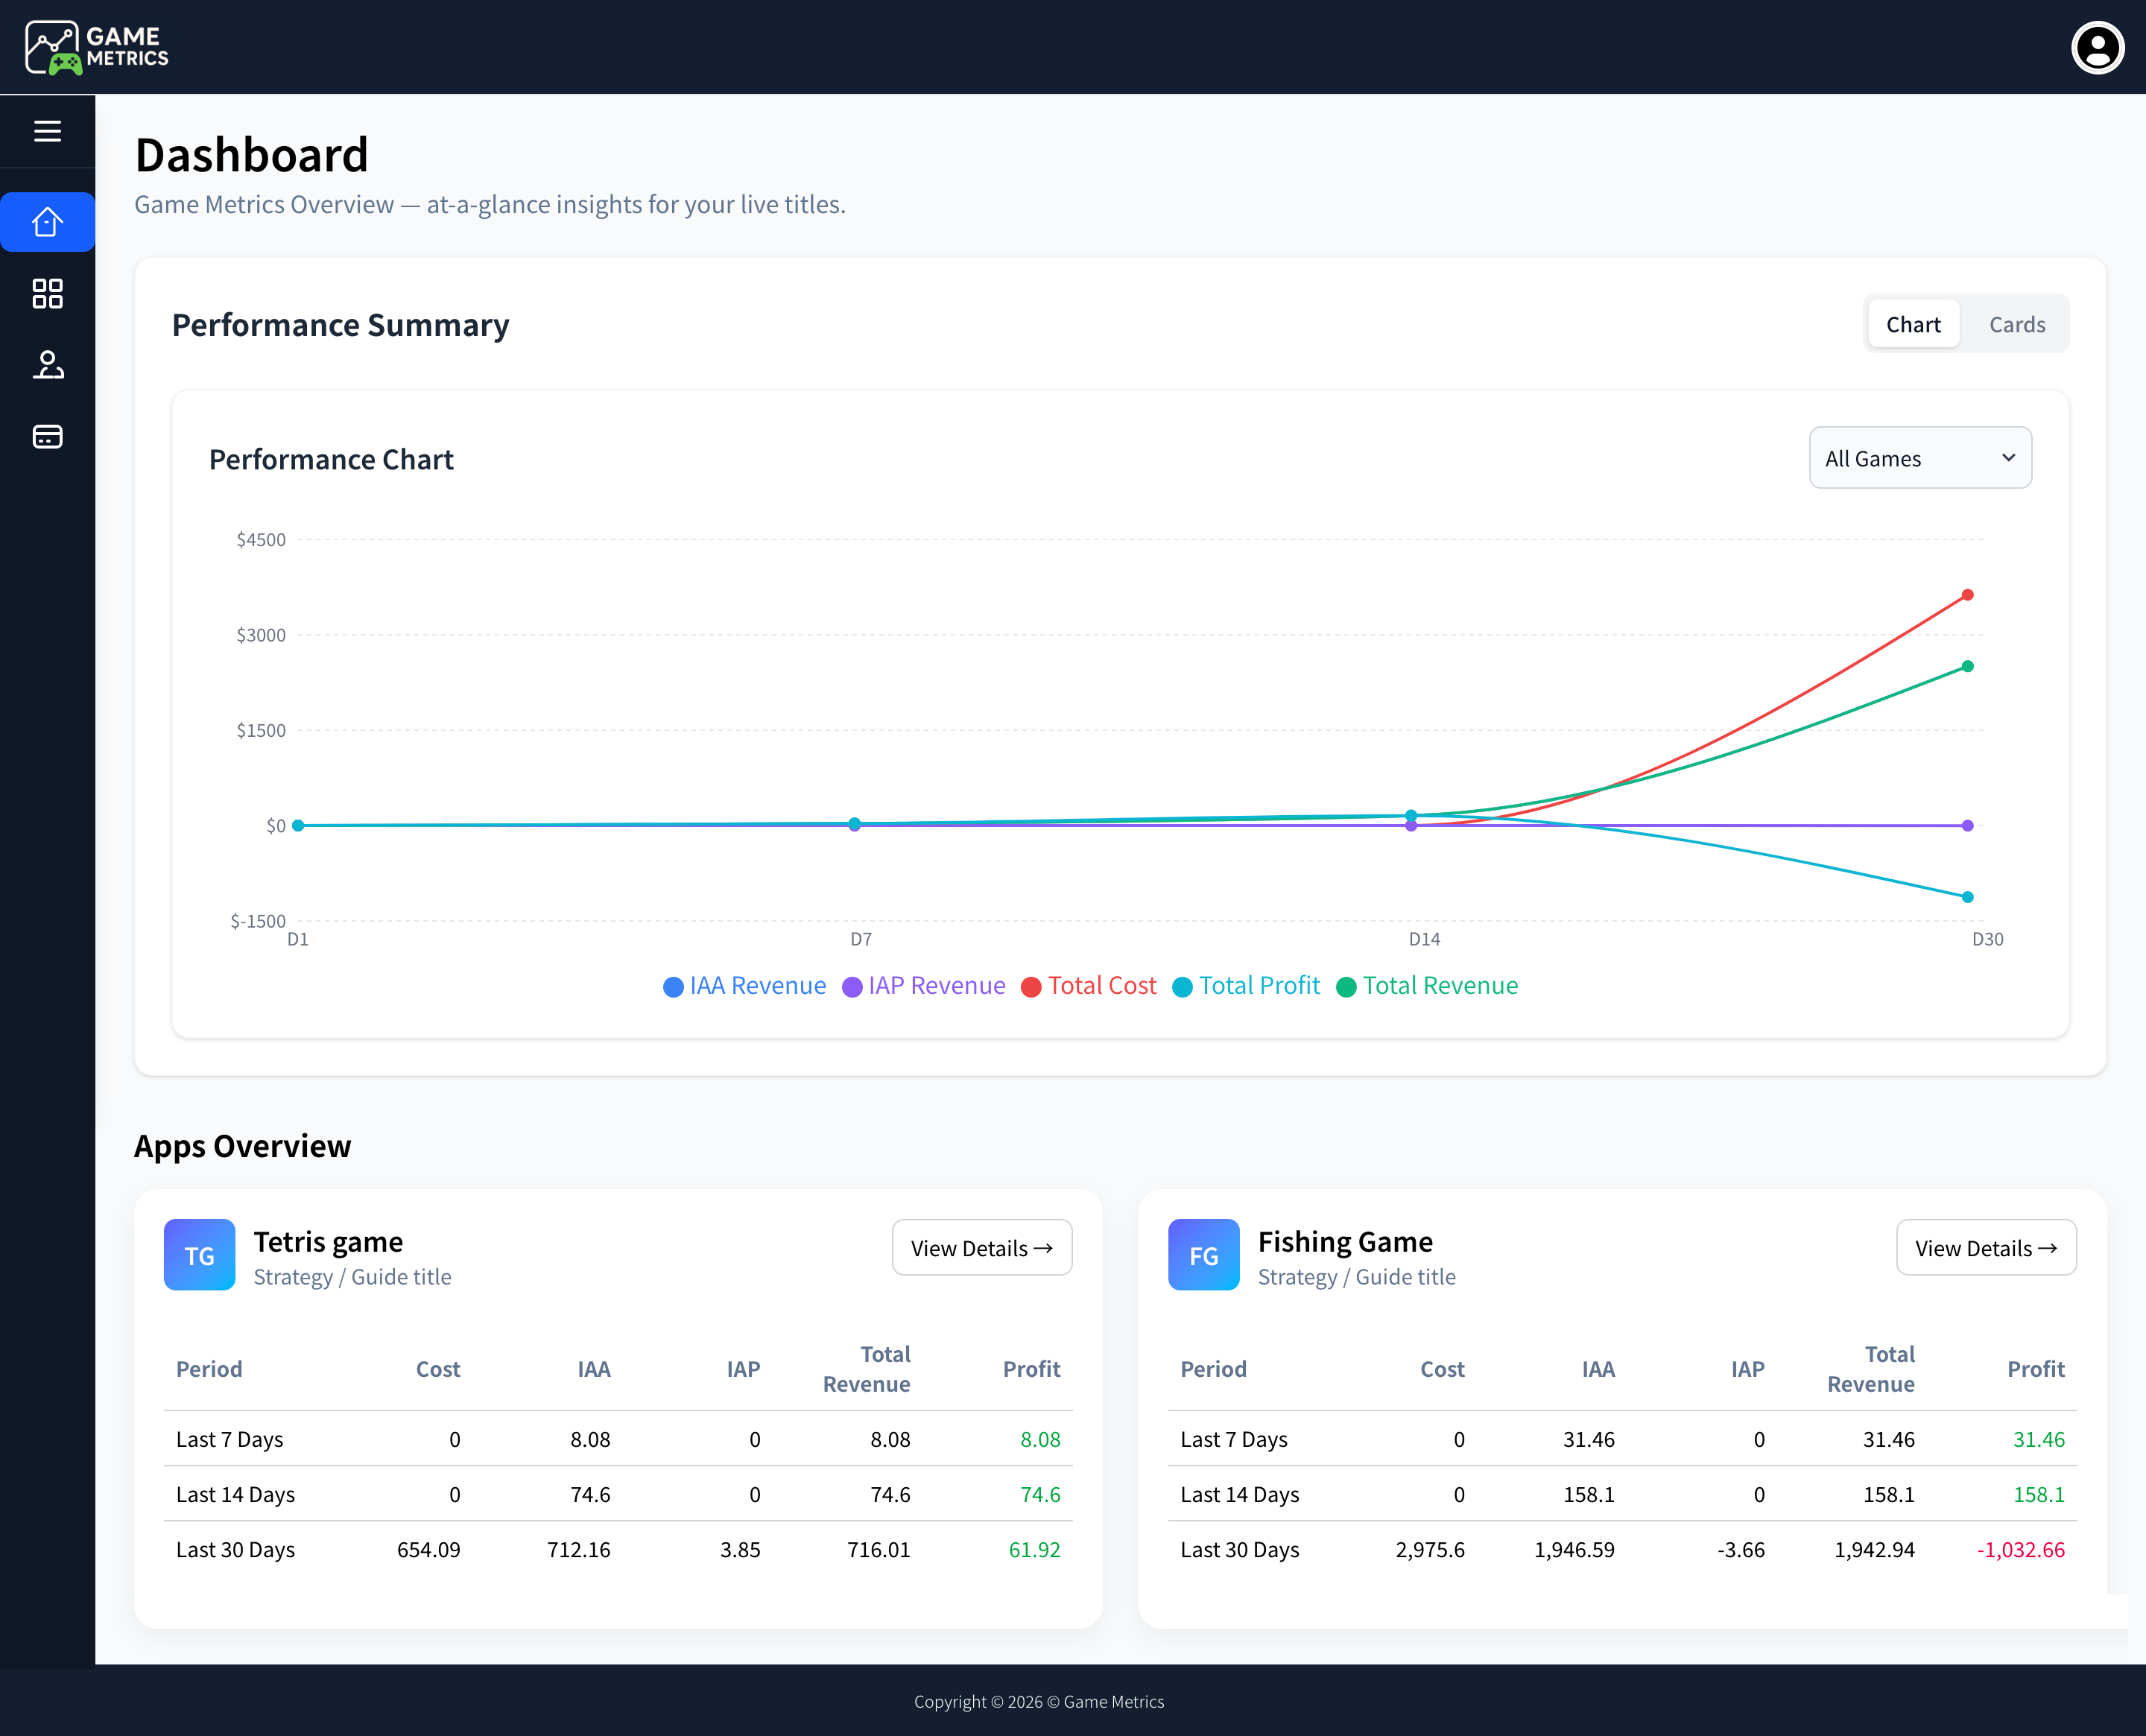
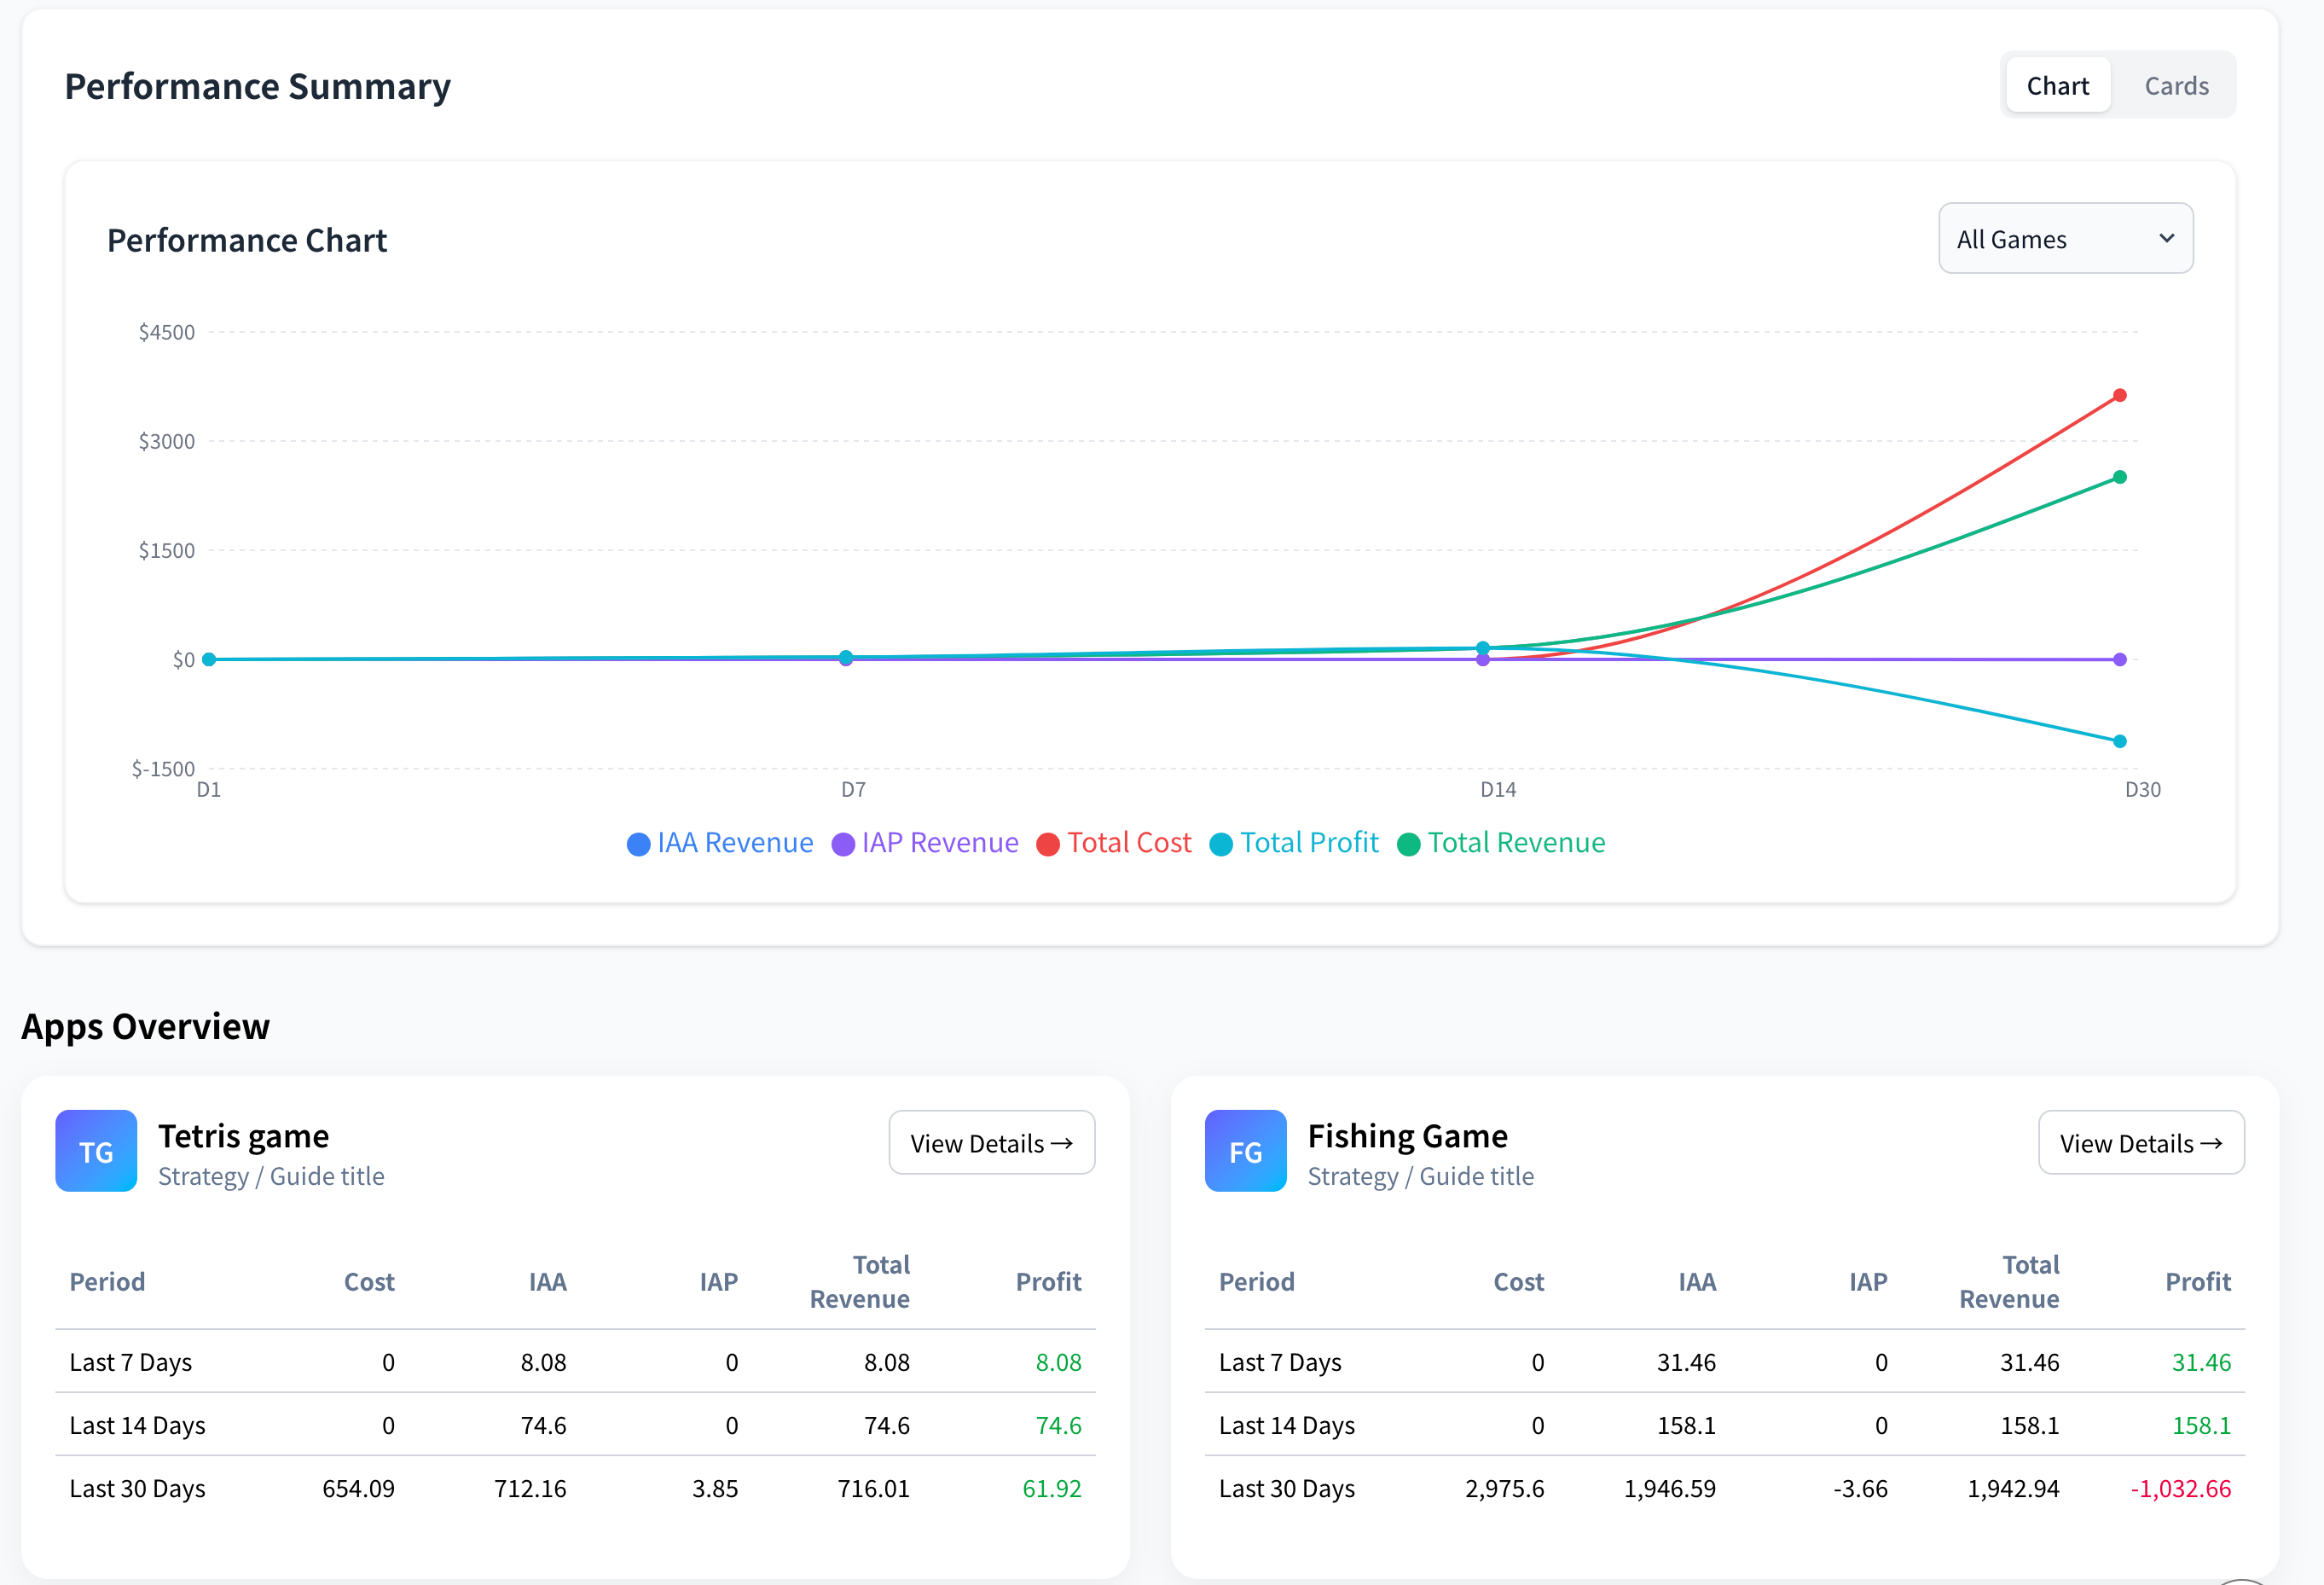
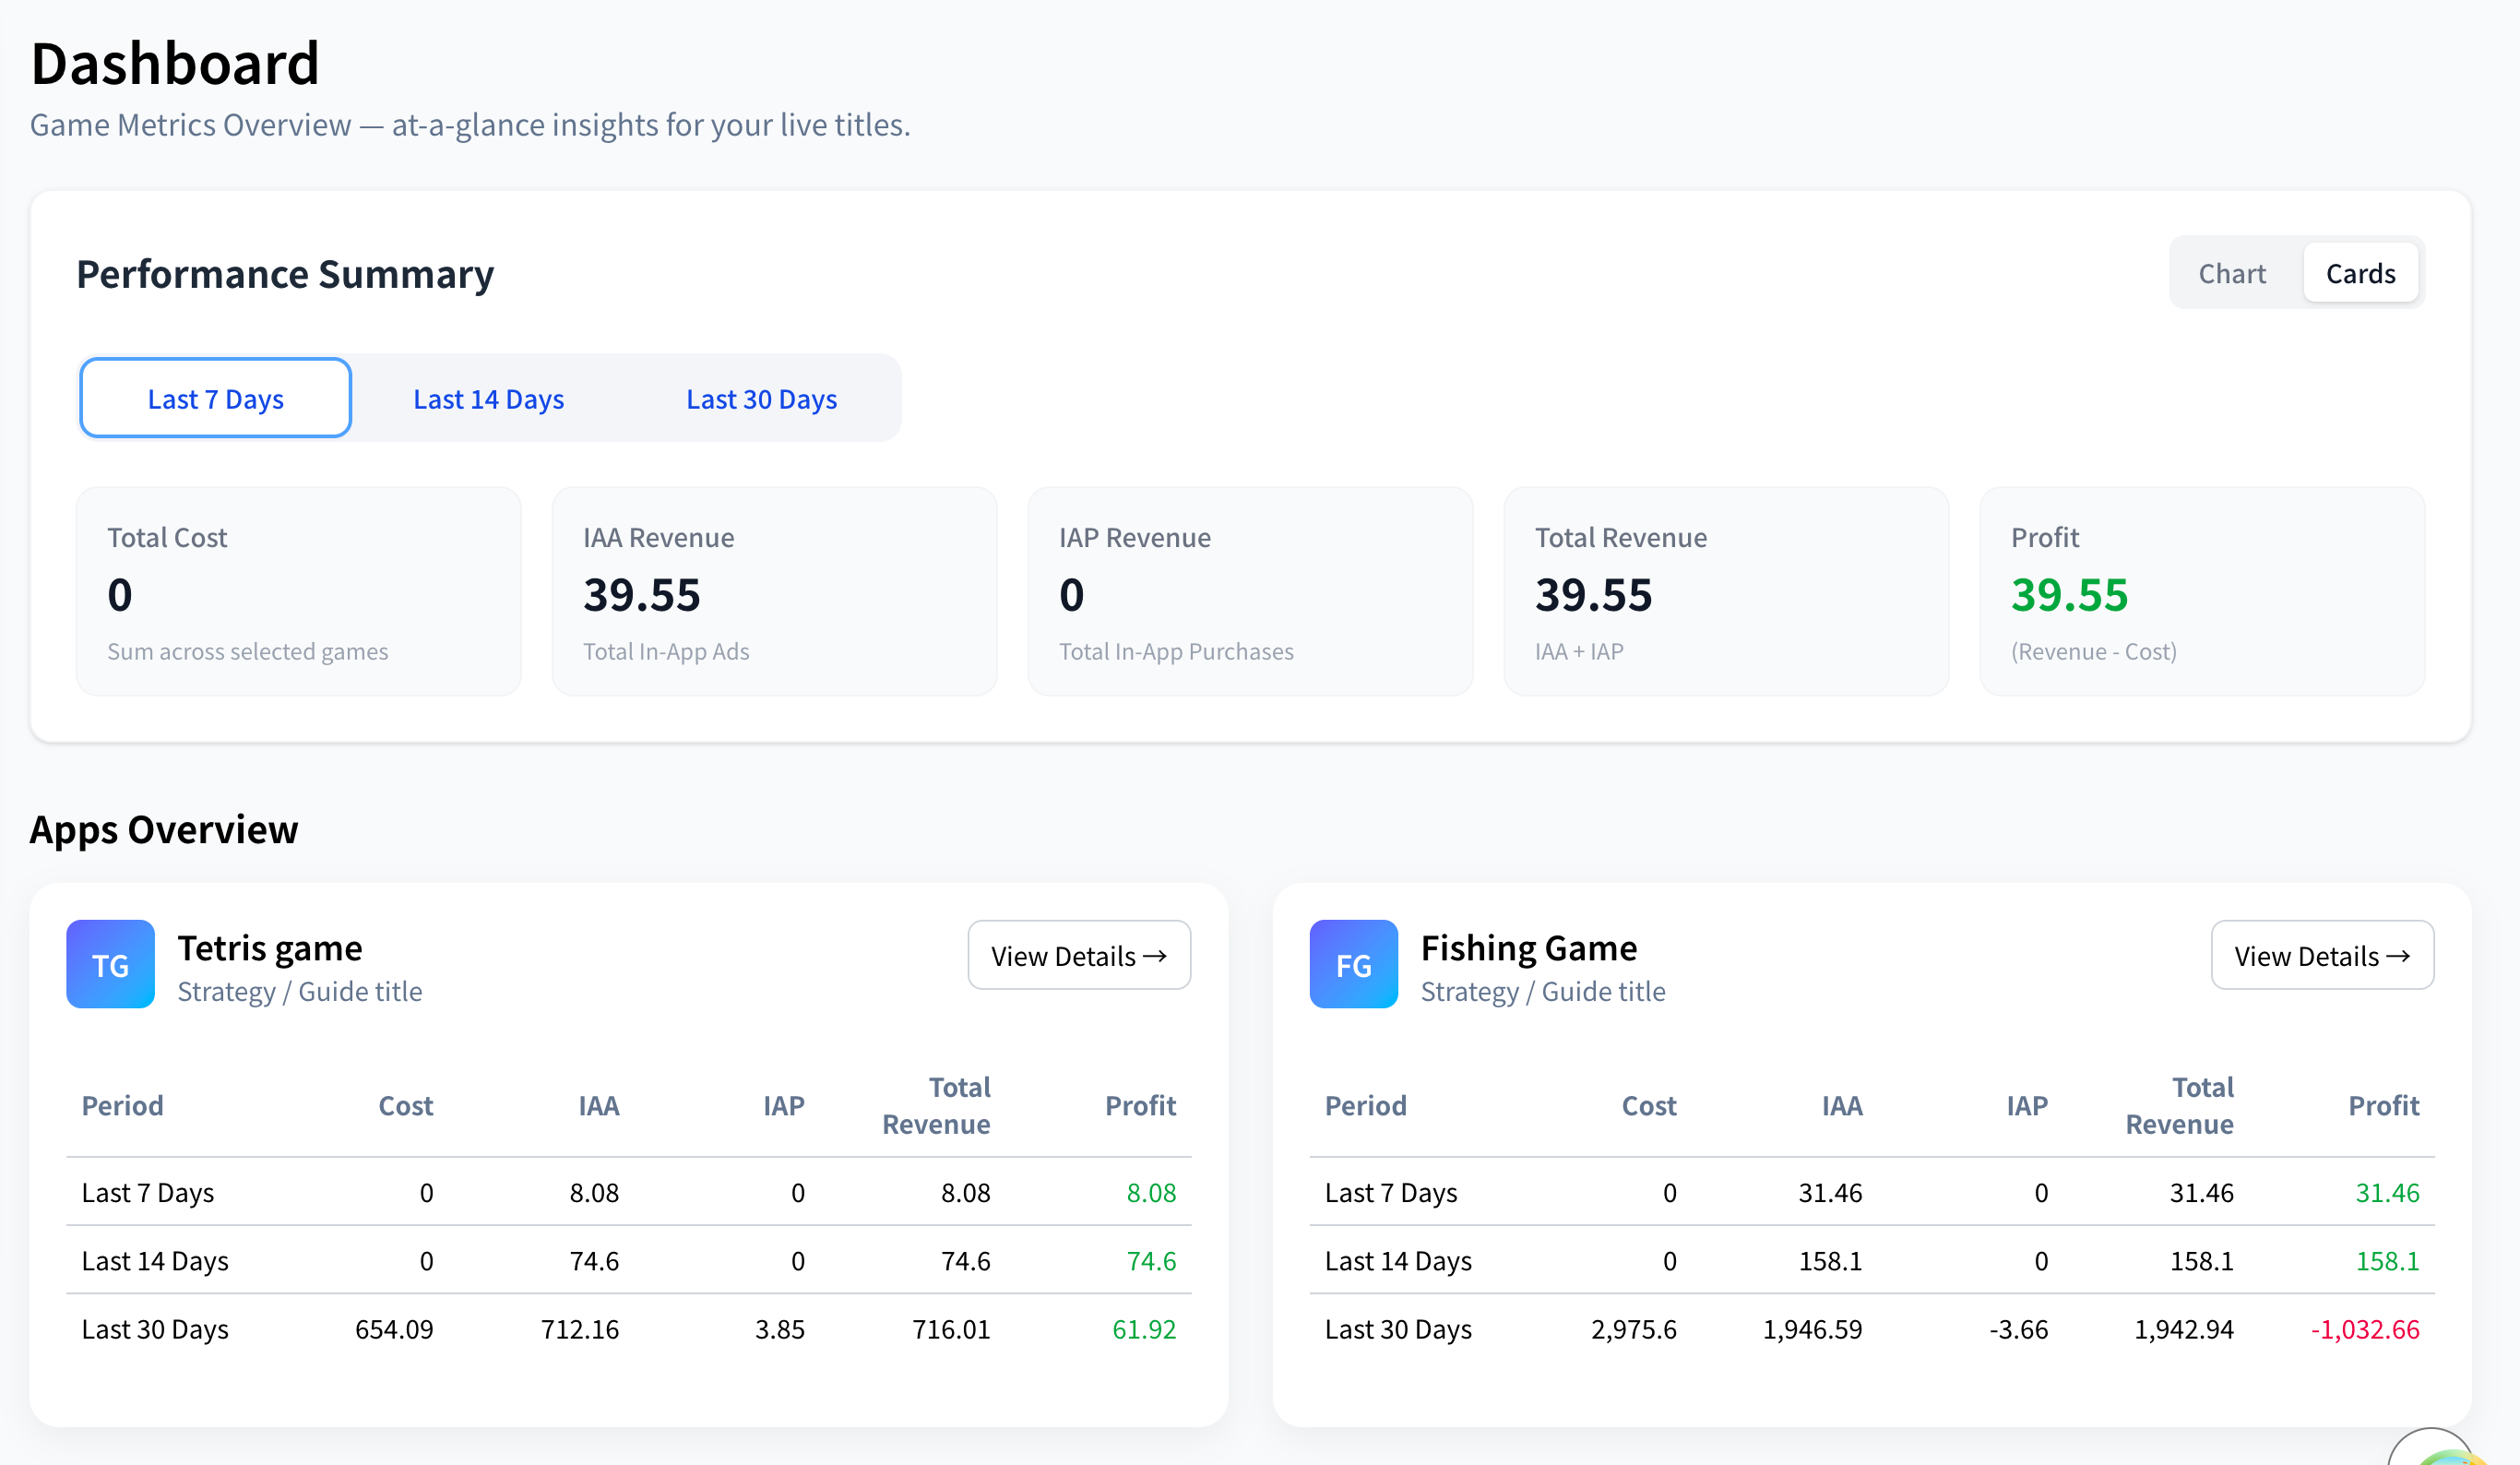
Dashboard Charts
Monitor all your games at a glance with comprehensive metrics including cost, revenue, and profit.
No credit card required. Explore pre-populated high-growth and sandbox telemetry dashboards.
Active Studios
Games Tracked
Events Processed
Revenue Analyzed
Free Mobile Game KPI Tools
Use our free calculators to benchmark your game's performance against industry standards. No signup required.
Free Game Retention Calculator
Calculate your D1, D7, and D30 retention rates and compare against benchmarks for your genre. Understand what good retention for mobile games looks like.
Calculate Retention →ARPDAU Calculator
Calculate your Average Revenue Per Daily Active User by combining IAP and ad revenue. Benchmark your ARPDAU against industry standards.
Calculate ARPDAU →LTV Calculator
Estimate player Lifetime Value based on retention curves and monetization data. Essential for calculating profitable UA spend and ROAS.
Calculate LTV →Who Metrics Is Built For
Perfect For
- ✔ Indie game developers
- ✔ Mid-tier mobile app publishers
- ✔ Studios without huge data teams
- ✔ Anyone looking to save on BigQuery costs
Not really meant for
- ✖ Massive AAA game studios with 50+ analysts
- ✖ Custom engine games that can't send Webhooks
Firebase BigQuery Export → Game Analytics Dashboard
Stop manually exporting CSVs. Our game analytics tool connects directly to your Firebase BigQuery export and GA4 API to give you a unified retention dashboard with all your mobile game KPIs in one place.
Unified Revenue & IAP
Track Ad Revenue and In-App Purchases (IAP) in a single column to calculate true LTV.
Retention Rate (RR)
Advanced cohort analysis to monitor Day-1, Day-7, and Day-30 retention across different sources.
Campaign Strategy Optimization
Identify which ad campaigns are driving high-quality users and adjust your budget accordingly.
Get Your Game Dashboard
in 3 Simple Steps
Connect Google BigQuery
Link your BigQuery project to securely sync and process raw game data.
Connect Google Analytics 4
Integrate via GA4 API to fetch real-time events and user analytics.
Start Tracking Game KPI Metrics
Relax as we crunch the numbers into beautiful, actionable reports.
Game Analytics Tool: From Raw Events to Actionable KPIs
Our game analytics dashboard processes raw Firebase events and turns them into the mobile game KPIs that matter — player retention, ARPDAU, LTV, ROAS, and economy balance — so you can make data-driven decisions.
Player LTV Predictions
Use machine learning to forecast the lifetime value of users early in their lifecycle.
Revenue Diversification
Split in-app purchases versus ad revenue metrics to see true user profitability.
Player Retention Analysis
Understand exactly where users drop off and identify sticky features that keep them playing.
Match-Based Engagement
Analyze win/loss ratios, match durations, and difficulty curves for competitive multiplayer titles.
Activity Event Metrics
Track standard ad impressions, ad clicks, rewarded videos, and interstitials effortlessly.
Powerful Filters
Slice your game data across countries, ad networks, OS versions, and app versions easily.
What Is a Good Retention Rate for Mobile Games?
Understanding player retention is critical for every mobile game studio. Retention rate measures how many players return to your game after their first session — and it's the single most important KPI for long-term success.
D1, D7, and D30 Retention Explained
Day-1 (D1) Retention measures the percentage of players who return to your game exactly one day after install. A strong D1 signals good onboarding, clear value, and an engaging first session.
Day-7 (D7) Retention shows how many players are still active after a week. This reflects whether your core loop is compelling enough to keep players engaged beyond initial curiosity.
Day-30 (D30) Retention is the long-term engagement indicator. Games with strong D30 retention typically have deep progression systems, social features, or competitive elements.
💡 Why Retention Matters
A 5% improvement in D1 retention can translate to 20–30% more revenue over a game's lifetime. Tracking retention in your game analytics dashboard lets you identify drop-off points and optimize your game loop systematically.
Retention Benchmarks by Game Genre
| Genre | D1 | D7 | D30 |
|---|---|---|---|
| Hyper-Casual | 30–40% | 8–12% | 2–4% |
| Casual / Puzzle | 35–45% | 12–18% | 5–8% |
| Mid-Core / Strategy | 30–40% | 15–22% | 6–10% |
| RPG / Simulation | 25–35% | 12–20% | 5–9% |
Source: Industry benchmarks, 2024–2025 mobile gaming reports.
How Firebase BigQuery Export Helps Game Analytics
Firebase Analytics collects event data from your mobile game. The Firebase BigQuery export sends that raw data into Google BigQuery — giving you access to granular, user-level analytics that Firebase's built-in reports can't provide.
1. Enable BigQuery Export
In your Firebase Console, go to Project Settings → Integrations → BigQuery. Toggle on the export for your game app. Firebase syncs raw event data daily.
2. Query with BigQuery
BigQuery stores every user event, session, and property. You can run SQL queries to calculate retention cohorts, LTV, ARPDAU, and funnel analysis — but writing SQL is complex and time-consuming.
3. Metrics Does It For You
Metrics Analytics reads your Firebase BigQuery export directly. No SQL required. We automatically calculate retention, revenue, ARPDAU, and cohort metrics and present them in a beautiful game analytics dashboard.
Why Raw SQL Is Not Enough
Most indie game studios don't have a dedicated data analyst or SQL engineer. Firebase BigQuery export tables are complex — nested schemas, repeated fields, and billions of rows that cost real money to scan. Writing retention queries alone requires joining multiple tables and handling edge cases in user sessions.
Metrics Analytics eliminates this complexity. Connect your BigQuery credentials once, and our game analytics tool transforms raw event data into the KPIs you need — D1/D7/D30 retention, ARPDAU, LTV, cohort charts, and revenue breakdowns — updated daily and presented in a dashboard built specifically for mobile game developers.
Why Indie Studios Need a Dedicated Game Analytics Tool
Spreadsheets and manual dashboards can't keep up with the data volume of a growing mobile game. Here's why a dedicated game analytics dashboard matters for indie studios.
Without a Game Analytics Tool
- ✖ Manual CSV exports from GA4, AdMob, and Play Console
- ✖ Retention calculations in spreadsheets — slow and error-prone
- ✖ No cohort analysis or LTV predictions
- ✖ Hours spent writing BigQuery SQL for basic KPIs
- ✖ No multi-game overview across your portfolio
With Metrics Analytics Dashboard
- ✔ Automatic data sync from Firebase BigQuery export & GA4
- ✔ Instant retention dashboards — D1, D7, D30 calculated daily
- ✔ LTV, ARPDAU, and cohort charts — zero SQL required
- ✔ Revenue breakdown: IAP + Ad Revenue in one view
- ✔ Multi-game portfolio dashboard — monitor all games at once
What Game Studios Say
Join hundreds of studios that have automated their reporting workflow.
Alex Johnson
CEO at IndiePixel Games
"Before Metrics, I spent every Monday morning manually aggregating data from AdMob, Unity Ads, and GA4 into a spreadsheet. Now, I have everything in one place. It's a game-changer for our UA strategy."
Maria Lopez
Lead Data Analyst at PlayFun
"The BigQuery integration is seamless. Being able to see Revenue and RR side-by-side without leaving the dashboard allows us to optimize our ad spend in real-time. Highly recommended!"
David Kim
Growth Manager at SkyStudio
"The convenience of having GA4 and Admob data merged automatically is incredible. We've reduced our monthly overhead and increased our IAP revenue by focusing on what matters: the data."
Simple Pricing for Indie Studios
Start small. Scale as your game grows.
Starter
Up to 5 games
- Up to 5 games
- Basic analytics
- Email support
- 2 Users account
Growth
Up to 10 games
- Up to 10 games
- Advanced analytics
- Priority support
- Custom dashboards
Enterprise
Up to 50 games
- Up to 50 games
- Full analytics suite
- 24/7 support
- Dedicated account manager
Frequently Asked Questions
Metrics Analytics is a game analytics dashboard built for mobile game developers. It connects to your Firebase BigQuery export and GA4 API to calculate and display essential game KPIs — including retention rates (D1, D7, D30), ARPDAU, LTV, ROAS, revenue breakdowns, and cohort analysis — all without writing SQL.
Industry benchmarks for mobile game retention vary by genre. For casual games, a good Day-1 retention is 35–45%, Day-7 is 12–18%, and Day-30 is 5–8%. Hyper-casual games have lower long-term retention (D30: 2–4%), while mid-core and strategy games can achieve D30 retention of 6–10%. Use the retention benchmarks table above for detailed genre-specific data.
To enable Firebase BigQuery export: go to your Firebase Console → Project Settings → Integrations → BigQuery → Toggle on the export. Firebase will automatically sync raw event data to a BigQuery dataset every 24 hours. Once enabled, you can connect your BigQuery credentials to Metrics Analytics and we'll automatically generate your game analytics dashboard from the exported data.
Essential mobile game KPIs include: DAU/MAU (Daily/Monthly Active Users), Retention Rate (D1, D7, D30), ARPDAU (Average Revenue Per Daily Active User), LTV (Lifetime Value), ROAS (Return on Ad Spend), session length, and revenue split (IAP vs. Ad Revenue). Metrics Analytics tracks all of these automatically through your Firebase BigQuery export.
ARPDAU (Average Revenue Per Daily Active User) = Total Daily Revenue (IAP + Ad Revenue) ÷ Daily Active Users. For example, if your game earns $500/day with 10,000 DAU, your ARPDAU is $0.05. A good ARPDAU for casual games is $0.03–$0.10, while mid-core games can achieve $0.10–$0.30. Metrics Analytics calculates this automatically from your BigQuery data.
In your dashboard, go to "Add New App". You will need to upload the credential.json
file for both BigQuery and GA4. These files allow our app to securely access your data via
official Google APIs. Check our Step-by-Step Setup Guide here.
To export data, you must enable the "BigQuery Export" in your Firebase console settings. Once enabled, Firebase will automatically sync your raw events to a BigQuery dataset every 24 hours.
Go to the Google Cloud Console, navigate to "IAM & Admin" > "Service Accounts". Create a new service account, give it appropriate permissions (BigQuery Data Viewer, etc.), and then click "Manage Keys" to create and download a new JSON key file.
Have Questions?
Drop us a message and our team will get back to you.
Stop Writing SQL for Basic Game KPIs.
Start Using a Real Game
Analytics Dashboard.
Join 1,000+ indie mobile game studios who replaced spreadsheets and manual BigQuery queries with Metrics Analytics.
Latest Insights
Stay updated with the latest in game analytics, marketing, and monetization.
Unlock Your Firebase Game Analytics: Actionable KPIs Without SQL for Indie Studios
Indie mobile game studios can now unlock powerful Firebase BigQuery analytics without SQL. Metrics Analytics transforms raw data into actionable KPIs like retention, ARPDAU, and LTV.
Firebase & BigQuery Game Analytics for Indie Studios: Unlock KPIs Without SQL
Indie game studios can leverage Firebase and BigQuery for deep analytics, but SQL complexity is a barrier. Discover how to get actionable KPIs like retention, LTV, and ARPDAU without writing a single line of SQL.

Unlocking Game Growth: SQL-Free Analytics for Indie Mobile Developers with Firebase & BigQuery
Empower your indie mobile game studio with actionable insights from Firebase and BigQuery data, no SQL required. Discover key KPIs like retention, ARPDAU, and LTV.